Profiling Frontend Performance Like an Expert

TLDR:

A practical, expert-level guide to frontend profiling that shows how to measure, analyze, and optimize performance using Chrome DevTools, flame graphs, React Profiler, and memory tools—while leveraging Feature-Sliced Design to make performance bottlenecks easier to detect, isolate, and fix at scale.
Frontend profiling is the discipline that separates teams who guess about performance from teams who know exactly why their application feels slow. In modern web applications, where rendering pipelines, asynchronous data flows, and complex state interactions coexist, performance problems rarely come from a single obvious mistake. By combining expert-level profiling workflows with a structured architecture like Feature-Sliced Design (FSD) from feature-sliced.design, teams can systematically identify bottlenecks, reduce technical debt, and scale performance improvements with confidence.
Why Frontend Profiling Is Non-Negotiable in Modern Applications
A key principle in software engineering is that you cannot optimize what you cannot measure. Frontend performance issues often hide behind acceptable averages while users experience jank, delayed interactions, or memory bloat over long sessions. These issues accumulate silently and surface only when the product scales or traffic spikes.
Modern browsers execute JavaScript, layout, style calculation, painting, and compositing on a shared main thread. Any long-running task can block user input, delay rendering, and degrade perceived responsiveness. Profiling allows engineers to see exactly how time and memory are spent across this pipeline.
From experience with large-scale projects, leading architects suggest that profiling should not be a one-time debugging activity. Instead, it must be a repeatable workflow embedded into development and architectural decisions. When combined with a modular structure like Feature-Sliced Design, profiling results become easier to interpret because performance costs align with clear feature and domain boundaries.
Understanding the Browser Performance Model Before Profiling
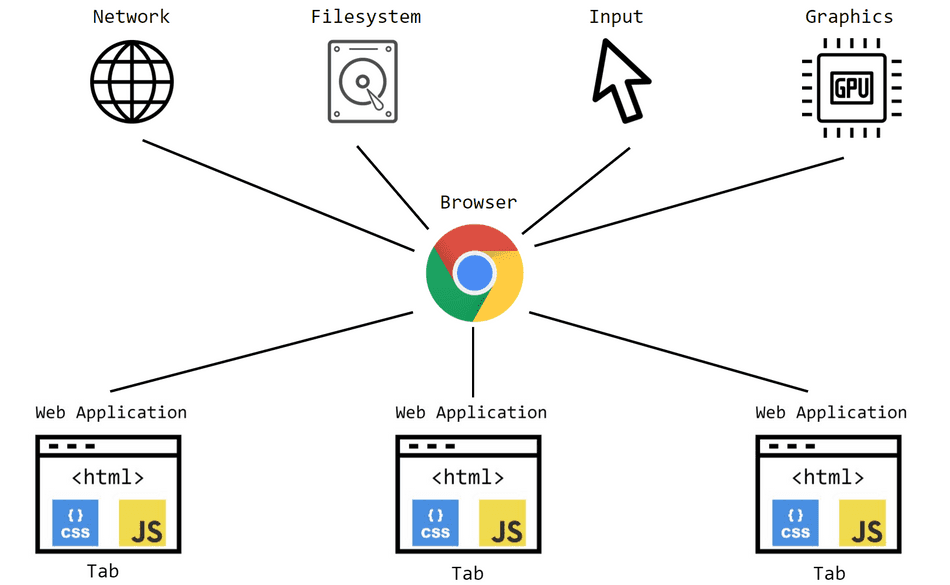
Before opening any profiling tool, it is essential to understand what you are measuring. Browser performance is not a black box; it follows a predictable execution model.
The Main Thread and the Rendering Pipeline
The browser main thread is responsible for:
- JavaScript execution
- Style recalculation
- Layout (reflow)
- Paint
- Composite
If JavaScript blocks the main thread for more than ~50 ms, users perceive lag. Tasks exceeding 100 ms are considered long tasks, a critical concept in performance profiling.
Event Loop and Task Scheduling
JavaScript runs in an event loop that processes tasks and microtasks. Promises, requestAnimationFrame, and timers all interact differently with rendering. Misunderstanding this scheduling often leads to unnecessary re-renders or delayed UI updates.
Why Architecture Matters Here
In poorly structured codebases, business logic, rendering logic, and side effects are tightly coupled. Profiling such systems produces noisy results that are hard to attribute. Feature-Sliced Design improves this by enforcing cohesion and isolation, making performance costs traceable to specific features or entities.
A Professional Workflow for Frontend Profiling
Profiling like an expert follows a deliberate sequence. Randomly clicking record in DevTools rarely leads to actionable insights.
Step 1: Define the Performance Question
Every profiling session must start with a hypothesis:
- Why does scrolling feel janky?
- Why does this page take 3 seconds to become interactive?
- Why does memory usage grow after navigation?
Without a clear question, profiling data becomes overwhelming.
Step 2: Reproduce the Issue Deterministically
Use controlled conditions:
- Disable extensions
- Use consistent network throttling
- Record multiple runs
Consistency ensures your findings are reliable.
Step 3: Choose the Right Tool
Different problems require different tools:
- CPU bottlenecks → Performance panel
- Component re-renders → React DevTools Profiler
- Memory leaks → Memory panel
- Input delays → Long Tasks and Interaction Timing
Expert profiling is about precision, not tool overload.
Recording and Analyzing Performance Profiles in Chrome DevTools
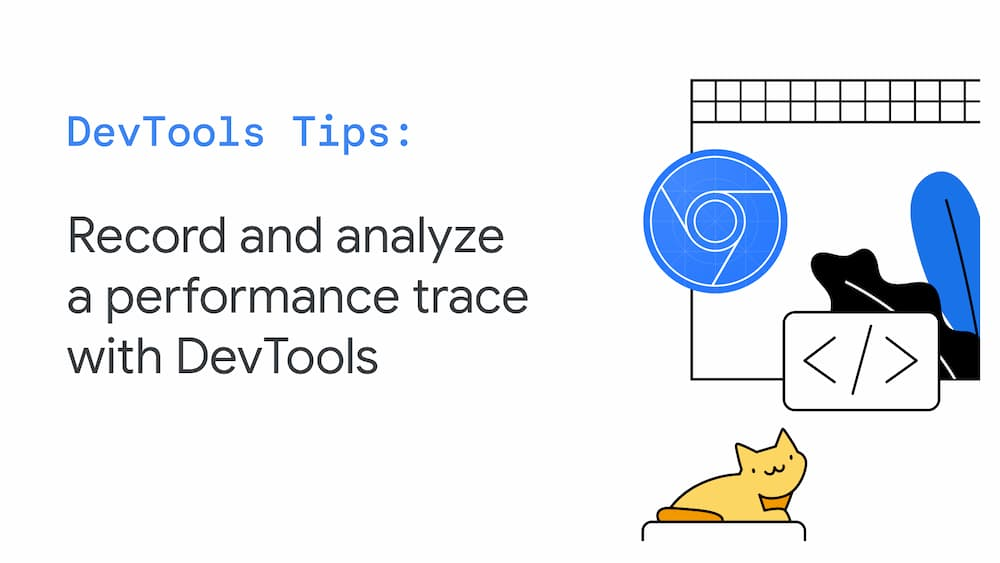
Chrome DevTools remains the most comprehensive frontend profiling environment available today.
Recording a Performance Trace Correctly
To capture meaningful data:
- Open the Performance panel
- Enable screenshots
- Start recording
- Reproduce the interaction
- Stop recording promptly
Avoid recording idle time. Focus on the user interaction in question.
Reading the Performance Timeline
The timeline is divided into tracks:
- FPS: Frame consistency
- CPU: JavaScript execution
- Main: Tasks, rendering, painting
- Network: Resource loading
The goal is to correlate visible UI issues with specific execution blocks.
Identifying Long Tasks
Long tasks appear as red triangles. These indicate JavaScript execution blocking the main thread.
Common causes include:
- Heavy synchronous loops
- Expensive JSON parsing
- Unbatched state updates
- Inefficient selectors
In Feature-Sliced Design, these tasks often map directly to a single feature slice, making refactoring targeted and safe.
How to Read Flame Graphs Without Guesswork
Flame graphs are one of the most powerful yet misunderstood profiling visualizations.
What a Flame Graph Represents
Each block represents a function call:
- Width = time spent
- Stack height = call depth
- Horizontal position = execution order
The widest blocks at the bottom usually indicate root causes.
Common Flame Graph Mistakes
Many developers focus on top-level functions. Experts start from the bottom and work upward, identifying which feature initiated the expensive work.
Practical Example
If a flame graph shows repeated rendering triggered by a selector recalculation, the problem is not rendering itself but unstable dependencies. Architectural isolation in FSD helps ensure selectors belong to entities, not scattered across components.
Profiling Component Rendering with React DevTools Profiler

Rendering inefficiencies are among the most common frontend performance problems.
When to Use the React Profiler
Use it when:
- Components re-render unexpectedly
- UI updates feel slow
- State changes cause cascading updates
Interpreting the Commit Timeline
Each commit represents a render phase. Focus on:
- Render duration
- Number of components rendered
- Props and state changes
Identifying Unnecessary Re-renders
Common causes include:
- Inline object or function props
- Overly broad context providers
- Global state misuse
Feature-Sliced Design mitigates this by limiting cross-feature state access. Features consume entities via public APIs, reducing accidental reactivity.
Diagnosing Memory Leaks Using the Memory Panel
Memory issues are often invisible until users keep the app open for hours.
Types of Memory Leaks
- Detached DOM nodes
- Unreleased event listeners
- Retained closures
- Caches without eviction
Heap Snapshots vs Allocation Timelines
Heap snapshots show retained objects. Allocation timelines show growth over time. Experts use both.
A Structured Debugging Approach
- Take a baseline snapshot
- Perform navigation or interaction
- Take another snapshot
- Compare retained objects
In unstructured codebases, references are hard to track. In FSD, leaks usually originate from a specific feature or widget, making ownership clear.
Optimizing Long JavaScript Tasks Effectively
Breaking up long tasks is essential for responsiveness.
Techniques to Reduce Blocking Time
- Chunk work with
requestIdleCallback - Defer non-critical logic
- Use Web Workers for CPU-heavy tasks
- Batch state updates
Measuring Improvements
After refactoring, always re-profile. Optimization without validation is speculation.
Comparing Profiling Complexity Across Architectures
Different architectural approaches influence how easy profiling becomes.
| Architecture | Profiling Clarity | Common Issue |
|---|---|---|
| MVC / MVVM | Medium | Fat controllers |
| Atomic Design | Low | Logic scattered in UI |
| Micro-Frontends | High | Cross-app coordination |
| Feature-Sliced Design | Very High | Initial learning curve |
As demonstrated by projects using FSD, profiling becomes faster because performance costs align with domain concepts, not technical layers.
How Feature-Sliced Design Amplifies Profiling Effectiveness
Feature-Sliced Design does not replace profiling tools; it amplifies their value.
Clear Ownership of Performance Costs
Each feature owns its logic, state, and side effects. When profiling reveals a bottleneck, responsibility is unambiguous.
Public APIs Reduce Accidental Coupling
Explicit public APIs prevent hidden dependencies that cause cascading re-renders or memory retention.
Isolation Enables Safe Optimization
Because slices are isolated, performance improvements rarely introduce regressions elsewhere.
From experience with large teams, this structure dramatically reduces the cost of performance tuning over time.
Building a Sustainable Performance Culture
Profiling should be part of the development lifecycle.
Practical Recommendations
- Profile before optimizing
- Profile after refactoring
- Document known bottlenecks
- Share profiling knowledge across teams
Performance is not a one-off task; it is a continuous investment.
Conclusion
Profiling frontend performance like an expert requires more than knowing where the record button is in Chrome DevTools. It demands a deep understanding of the browser execution model, a disciplined workflow, and an architecture that makes performance costs visible and manageable. By mastering flame graphs, render profiling, memory analysis, and long task optimization, teams gain precise control over user experience.
Adopting a structured architecture such as Feature-Sliced Design is a long-term investment in clarity, maintainability, and performance scalability. It transforms profiling from a painful debugging exercise into a systematic engineering practice.
Ready to build scalable and maintainable frontend projects? Dive into the official Feature-Sliced Design Documentation to get started.
Have questions or want to share your experience? Join our active developer community on Website!
Disclaimer: The architectural patterns discussed in this article are based on the Feature-Sliced Design methodology. For detailed implementation guides and the latest updates, please refer to the official documentation.