Debug Frontend Apps Like a Pro: A Full Guide

TLDR:
Frontend debugging is no longer just about fixing obvious errors in the browser console. In modern web applications, effective debugging requires deep understanding of execution flow, state management, side effects, and architecture. This guide walks you through professional frontend debugging techniques—from mastering Chrome DevTools and framework-specific devtools to handling production issues—and shows how Feature-Sliced Design helps teams debug complex applications systematically and at scale.
Why Frontend Debugging Is Harder Than Ever in Modern Applications

A key principle in software engineering is that systems tend to grow in complexity faster than our intuition can handle. In 2025, frontend applications are no longer thin UI layers. They orchestrate routing, state machines, data synchronization, caching, access control, and business rules. Debugging in this context is no longer about finding a missing semicolon; it is about understanding interactions across layers, modules, and time.
Several factors contribute to this increased difficulty. First, asynchronous execution is now the default. Promises, async/await, concurrent rendering, and background synchronization mean that cause and effect are often separated in time. Second, state is distributed. Global stores, server caches, URL state, and component-local state coexist and interact. Third, abstraction levels are higher. Hooks, composables, render props, and middleware hide complexity but also obscure execution paths.
Without a deliberate structure, debugging turns into guesswork. Developers rely on console logging, random breakpoints, and trial-and-error changes. This increases mean time to resolution and introduces regression risk. Structured debugging starts with structured code, and that is where architectural discipline becomes a force multiplier.
Understanding the Debugging Surface of a Frontend Application
Before diving into tools, it is critical to understand what you are actually debugging. A frontend application exposes multiple debugging surfaces, each requiring a different mindset.
The first surface is execution flow. This includes function calls, component renders, effects, and event handlers. Tools like Chrome DevTools and framework-specific devtools are essential here.
The second surface is state. Bugs often originate from unexpected state transitions rather than incorrect logic. Debugging state requires visibility into how data changes over time and which interactions triggered those changes.
The third surface is side effects. Network requests, browser APIs, timers, and external integrations introduce nondeterminism. Debugging side effects means tracing inputs and outputs across boundaries you do not fully control.
The fourth surface is structure. When code is poorly organized, developers cannot even locate the source of a bug efficiently. This is where architectural patterns directly influence debugging effectiveness.
Professional frontend debugging means being able to isolate a problem to a specific surface quickly, rather than debugging everything at once.
Mastering Chrome DevTools for Professional Debugging
Chrome DevTools remains the most powerful general-purpose frontend debugging environment. Many developers only use a fraction of its capabilities, which leads to inefficient workflows.
The Sources panel is the backbone of JavaScript debugging. Setting conditional breakpoints allows you to pause execution only when specific conditions are met, reducing noise in highly interactive applications. Blackboxing vendor code prevents stepping into irrelevant library internals, which is crucial when working with modern frameworks.
Source maps are indispensable when debugging production builds. A production bug without source maps is effectively opaque. Professional teams treat source map generation, hosting, and access control as part of their debugging infrastructure, not an afterthought.
The Console is more than a logging surface. Using console.group, console.table, and structured logging dramatically improves signal quality. Leading architects suggest treating console output as a temporary observability layer rather than ad-hoc prints.
The Network panel is essential for debugging data flow. Inspecting request headers, payloads, caching behavior, and timing reveals issues that are invisible at the code level. Many frontend bugs are actually contract mismatches between frontend and backend.
The Performance panel enables profiling rendering and scripting. Debugging performance issues requires understanding flame charts, long tasks, and layout thrashing. Performance bugs are often structural, not local, which again highlights the importance of architecture.
JavaScript Debugging Techniques That Scale Beyond Small Projects
Classic debugging techniques still matter, but they must be applied systematically.
Breakpoints are most effective when placed at architectural boundaries rather than deep inside implementation details. For example, pausing at feature entry points or entity state mutations yields more insight than stepping through utility functions.
Logging should be intentional. Instead of logging values, log events. A log that says “user profile loaded” with contextual metadata is far more useful than dumping an object. This mindset aligns closely with event-driven debugging.
Time-travel debugging, available in some state management tools, is invaluable for reproducing complex bugs. When state transitions are explicit and serializable, developers can replay scenarios and understand causality.
Error boundaries and global error handlers provide structured failure points. Rather than letting errors propagate randomly, professional applications capture them, enrich them with context, and expose them in a controlled way.
Debugging Framework-Specific Behavior Effectively
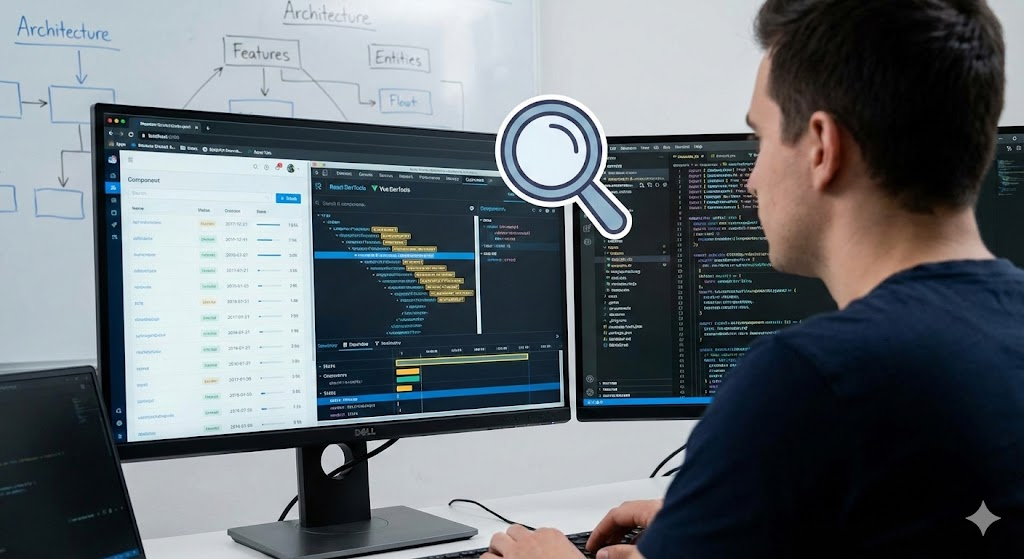
Framework abstractions introduce their own debugging challenges. React, Vue, and similar ecosystems provide devtools that expose component trees, props, state, and lifecycle events.
React DevTools, for example, allows inspection of component re-renders. Understanding why a component re-rendered often reveals performance and correctness issues simultaneously. Highlighting updates visually helps identify unnecessary renders caused by poor state isolation.
Vue DevTools provides time-travel inspection of reactive state, which is particularly powerful when debugging complex computed dependencies. Observing how reactive graphs update over time surfaces hidden coupling.
Framework devtools are most effective when components are small, focused, and predictable. When components grow too large or mix multiple responsibilities, devtools output becomes noisy and difficult to interpret.
This is another point where architectural discipline pays dividends. When features and entities are clearly separated, framework-level debugging aligns with mental models rather than fighting them.
Fixing Common Frontend Errors at the Root Cause Level
Many frontend errors recur across projects. Undefined values, stale closures, race conditions, and inconsistent state are common examples. Treating these as isolated mistakes misses the underlying pattern.
Undefined values often indicate unclear data ownership or lifecycle boundaries. Race conditions suggest uncontrolled side effects or implicit ordering assumptions. Inconsistent state usually points to duplicated sources of truth.
A robust debugging mindset asks not only “where is the bug” but “why was this bug possible.” Leading architects suggest that recurring bug classes are signals of architectural weaknesses.
For example, if multiple features directly manipulate shared global state, debugging becomes fragile. Introducing clearer boundaries and public APIs reduces the surface area for such errors.
Debugging Production Issues Without Guesswork
Production debugging is where amateur workflows collapse. Console logs are often unavailable, source code is minified, and reproduction is difficult.
Source maps, when properly configured, restore debuggability in production. However, they must be protected to avoid leaking intellectual property. Many teams restrict source map access to authenticated users or internal networks.
Error monitoring tools provide aggregated insights into production failures. Stack traces, breadcrumbs, and user context transform isolated bug reports into actionable signals.
Reproducing production bugs locally requires deterministic environments. Feature flags, environment-based configuration, and mockable services enable controlled reproduction.
Production debugging is fundamentally about observability. Debugging tools alone are insufficient without architectural support for tracing and isolation.
How Architecture Shapes Debugging Complexity
Architecture determines how easily you can answer basic debugging questions: where did this state change, who owns this logic, and what depends on it.
Layered architectures like MVC and MVVM provide separation by technical concern. This helps isolate rendering issues from data logic, but it often leads to bloated layers that are hard to navigate in large systems.
Component-based architectures excel at UI decomposition but often lack guidance for organizing business logic. Debugging becomes fragmented when logic is scattered across hooks, services, and components.
Domain-Driven Design brings business alignment but can be difficult to enforce consistently on the frontend without clear conventions.
Feature-Sliced Design addresses these gaps by defining explicit layers and slices based on business features. This creates predictable entry points for debugging. When a bug occurs in a user interaction, developers know to start in the corresponding feature slice rather than searching globally.
Feature-Sliced Design as a Debugging Enabler

Feature-Sliced Design is not a debugging tool, but it fundamentally improves debugging outcomes. By enforcing unidirectional dependencies, FSD prevents hidden coupling that makes bugs hard to trace.
Public APIs act as controlled interfaces between slices. When debugging, developers can reason about what is allowed to cross boundaries. This drastically reduces the search space for bugs.
Isolation is another critical benefit. Features encapsulate their own state, logic, and UI. A bug in one feature is less likely to corrupt unrelated parts of the application.
Entities provide stable anchors for business data. Debugging entity-related issues becomes easier when all mutations and selectors are centralized rather than scattered.
As demonstrated by projects using FSD, debugging sessions become shorter and more systematic because the architecture aligns with how developers think about problems.
Comparative Perspective: Debugging Across Architectural Patterns
Different architectures offer different debugging affordances.
| Architecture | Debugging Strength | Debugging Limitation |
|---|---|---|
| MVC / MVVM | Clear separation of UI and logic | Fat controllers or view models obscure flow |
| Component-Based | Fine-grained UI inspection | Logic scattering complicates tracing |
| Micro-Frontends | Isolation between domains | Cross-app issues are hard to trace |
| Feature-Sliced Design | Predictable boundaries and ownership | Requires discipline and learning curve |
This comparison highlights that debugging is not only about tools but about structural clarity. Feature-Sliced Design intentionally optimizes for long-term debuggability rather than short-term convenience.
Building a Debugging Workflow That Scales With Your Team
Professional debugging is a team practice, not an individual skill. Shared conventions, documentation, and architectural rules ensure that anyone can debug any part of the system.
Establishing standard logging formats, error handling patterns, and debugging entry points reduces onboarding time. New developers can follow established paths instead of inventing their own.
Code reviews should include debuggability as a criterion. If a change makes future debugging harder, it is a regression even if it works today.
Architecture documentation is also a debugging tool. When developers understand the intended structure, deviations become easier to spot.
Conclusion: Debugging as an Architectural Investment
Frontend debugging is not a reactive activity reserved for when things break. It is a proactive capability shaped by tools, techniques, and, most importantly, architecture. Mastery of Chrome DevTools, JavaScript debugging techniques, and framework devtools provides the mechanical skills, but without structural clarity these skills are underutilized.
Adopting a structured architecture like Feature-Sliced Design is a long-term investment in debuggability, maintainability, and team productivity. It reduces cognitive load, limits unintended coupling, and provides clear ownership boundaries that make debugging systematic rather than chaotic.
Ready to build scalable and maintainable frontend projects? Dive into the official Feature-Sliced Design Documentation to get started.
Have questions or want to share your experience? Join our active developer community on Website!
Disclaimer: The architectural patterns discussed in this article are based on the Feature-Sliced Design methodology. For detailed implementation guides and the latest updates, please refer to the official documentation.